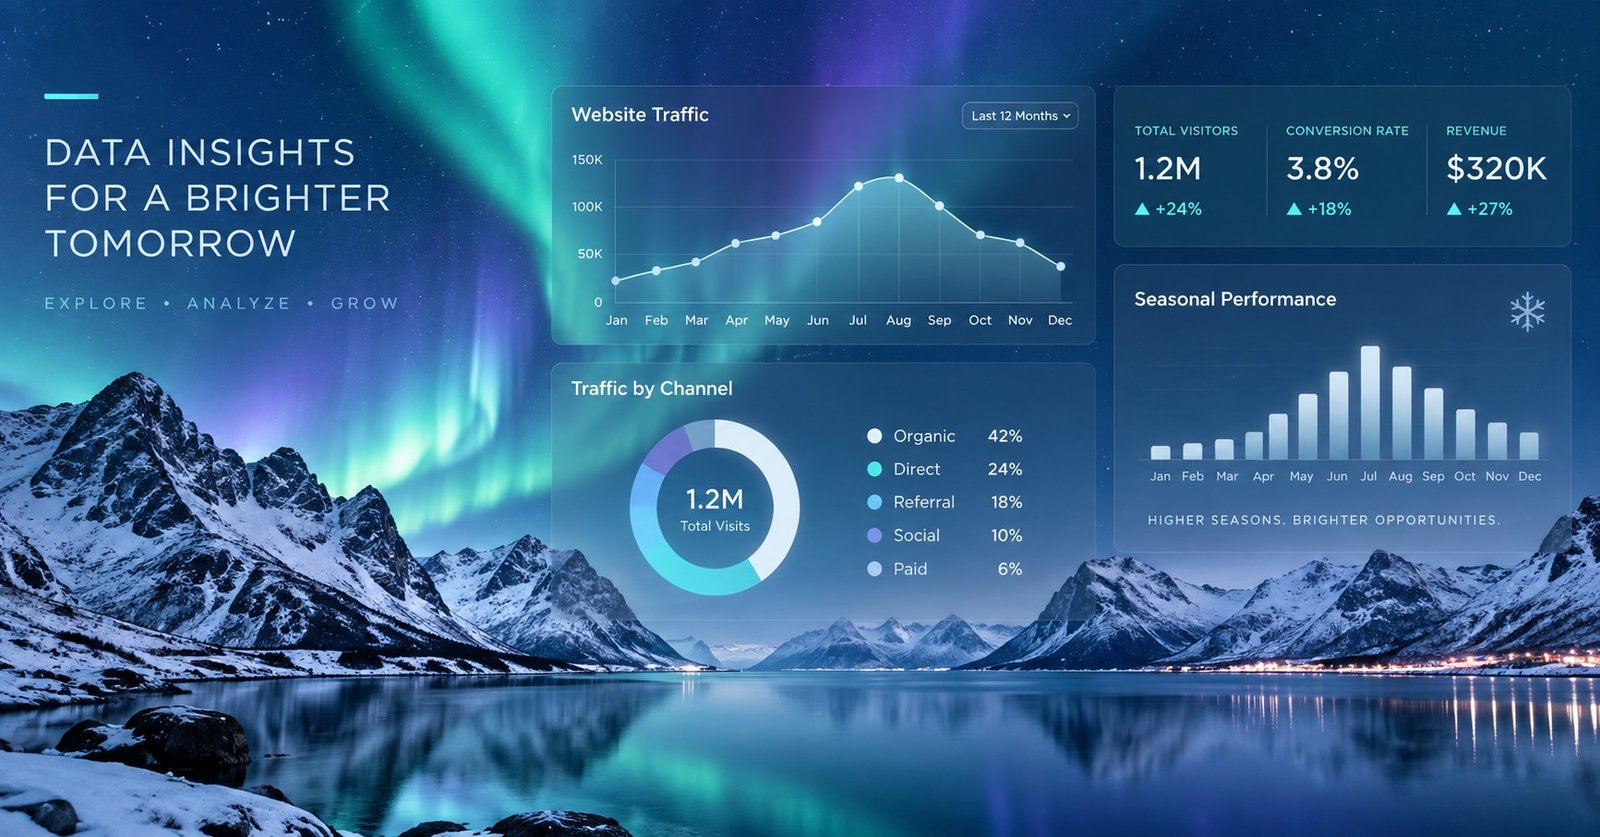
If your business runs on a rhythm that most analytics platforms were never designed to measure — a summer rush that triples revenue, a winter lull that stretches for months, or a shoulder season that arrives unpredictably — you already know that standard benchmarks rarely apply. For northern and seasonal businesses, the challenge isn’t a lack of data. It’s that the tools, benchmarks, and attribution models built for year-round urban markets often produce misleading signals when applied to markets shaped by geography, climate, and compressed demand windows.
Analytics for seasonal businesses is evolving in 2026, and the changes are significant. From the accelerating shift to first-party data to new approaches in demand forecasting and multi-touch attribution, this trend analysis covers what’s changing, what it means for northern brands, and how to adapt without overhauling your entire measurement stack.
Why Standard Analytics Benchmarks Fail Seasonal Businesses
Most industry benchmarks — average conversion rates, typical email open rates, standard cost-per-click ranges — are calculated from datasets dominated by businesses that operate at consistent volume throughout the year. When a northern outfitter generates 70% of its annual revenue between June and August, or a cold-climate tourism operator sees booking inquiries spike in January for summer trips, the “average” month is a statistical fiction.
The problem compounds when platforms use rolling 30-day windows as their default reporting period. A slow February doesn’t mean your marketing is failing — it may simply mean your audience isn’t in buying mode yet. Comparing February performance to a global benchmark, or even to your own October numbers, produces noise rather than insight.
The more useful comparison is year-over-year within the same seasonal window: How did this February compare to last February? Did your January inquiry volume grow relative to the same period in prior years? Are you capturing a larger share of the demand that exists in your market, even if that demand is inherently limited?
Building your own seasonal baselines — drawn from two or three years of your own data — is the foundational analytics practice that separates northern businesses that make good decisions from those that react to misleading signals.
The Shift to First-Party Data and What It Means for Northern Brands
The broader marketing industry has been moving toward first-party data for several years, driven by browser privacy changes, the deprecation of third-party cookies in some environments, and tightening consent requirements. For northern and remote businesses, this shift is both a challenge and an opportunity.
The challenge: smaller audience sizes mean that first-party datasets are inherently limited. A business serving a regional market of 50,000 people will never accumulate the volume of behavioral data that a national retailer can. Statistical models that require large samples to produce reliable outputs may simply not work at this scale.
The opportunity: consent-based, direct relationships with customers are more achievable at smaller scale. A northern outdoor retailer that asks customers to share their preferred activity, typical trip timing, and gear needs at the point of purchase can build a segmentation model that a mass-market competitor cannot replicate. That first-party data — collected with clear consent and stored in a CRM or email platform — becomes the foundation for demand forecasting, personalized outreach, and attribution that doesn’t depend on third-party tracking.
In 2026, the practical priority for most northern businesses is not adopting sophisticated data infrastructure. It is systematically collecting and organizing the first-party signals already available: purchase history, email engagement, booking patterns, and direct survey responses. Tools like Google Analytics 4, combined with a well-maintained CRM, provide a workable foundation for most businesses at this scale.
Demand Forecasting: Reading Seasonal Signals Before They Peak
One of the most valuable analytics applications for seasonal businesses is demand forecasting — using historical patterns and leading indicators to anticipate when demand will rise, how high it will go, and how long it will last. Done well, forecasting allows businesses to time marketing spend, staffing, and inventory decisions more precisely.
Several trends are making forecasting more accessible in 2026:
- Google Trends integration: Monitoring search interest for your core product or service categories over time provides a leading indicator of demand that often precedes actual purchases by weeks or months. A spike in searches for “northern fishing lodge” in late winter signals that booking season is approaching.
- GA4 predictive audiences: Google Analytics 4 includes machine-learning features that can identify users likely to purchase or churn within a defined window. For seasonal businesses, these signals are most useful when interpreted in the context of your own seasonal baseline rather than platform defaults.
- Email engagement as a leading indicator: Rising open and click rates on your list — even before a purchase spike — often signal that your audience is entering consideration mode. Tracking these trends week-over-week during the pre-season period can help you time promotional campaigns more precisely.
The important caveat: forecasting models trained on limited data should be treated as directional, not precise. A northern business with three years of clean historical data can identify broad seasonal patterns reliably. Predicting the exact week that demand will peak, or the precise revenue impact of a specific campaign, requires more data and more sophisticated modeling than most small businesses can justify.
Attribution in Long Buying Cycles: Moving Beyond Last-Click
Seasonal businesses often have long consideration windows. A family planning a northern wilderness trip may research options for three to six months before booking. A business buyer sourcing cold-climate equipment may evaluate suppliers across multiple seasons before committing. In these contexts, last-click attribution — which assigns full credit to the final touchpoint before conversion — systematically undervalues the awareness and consideration channels that initiated the journey.
The trend in 2026 is toward data-driven attribution models that distribute credit across multiple touchpoints based on observed conversion patterns. Google Analytics 4 uses a data-driven model by default for accounts with sufficient conversion volume. For businesses with lower traffic, the linear or time-decay models provide a more balanced view than last-click without requiring large datasets.
Practical steps for northern businesses:
- Set up GA4 conversion tracking for your most important actions: bookings, inquiry form submissions, email sign-ups, and purchases.
- Review the attribution model comparison report in GA4 to understand how credit shifts when you move from last-click to data-driven or linear models.
- Track assisted conversions — touchpoints that appeared in the path but weren’t the final click — to understand which channels are contributing to awareness and consideration even when they don’t close the sale.
For businesses using email automation to nurture leads across long buying cycles, connecting email engagement data to downstream conversions is particularly valuable. An email sequence that generates inquiries three months before the booking window opens deserves attribution credit that last-click models will never assign.
Practical Analytics Tools and Approaches for Remote Markets
The analytics tool landscape has expanded significantly, but for most northern and remote businesses, the priority is depth over breadth. A well-configured GA4 account, a maintained CRM, and a consistent email platform will produce more actionable insight than a fragmented stack of specialized tools.
Key configurations worth prioritizing in 2026:
- GA4 enhanced measurement: Enable scroll tracking, outbound link clicks, file downloads, and video engagement to capture behavioral signals beyond pageviews.
- Custom dimensions for seasonal context: Add parameters that tag sessions or events with seasonal identifiers (pre-season, peak, shoulder, off-season) to make year-over-year comparisons easier.
- Looker Studio dashboards: Connect GA4 and your email platform to a Looker Studio dashboard that displays your key metrics against your own seasonal baselines rather than platform defaults.
- UTM parameter discipline: Consistent UTM tagging across all campaigns — email, social, paid, and partner — is the foundation of reliable attribution. Without it, a significant share of traffic will appear as direct or unattributed, obscuring which channels are actually driving results.
For businesses that have invested in content marketing as a long-term traffic channel, GA4’s landing page report and search console integration provide visibility into which content is attracting organic traffic during the pre-season research window — often the highest-value period for content investment.
Turning Sparse Data Into Actionable Insights
The most common analytics frustration for northern businesses is sparse data: not enough conversions to reach statistical significance, not enough traffic to run reliable A/B tests, not enough historical data to build robust forecasting models. This is a real constraint, and it’s worth being honest about what analytics can and cannot tell you at small scale.
What analytics can reliably tell you even with limited data:
- Directional trends: Is organic traffic growing or declining year-over-year? Are email subscribers engaging more or less than last season?
- Channel mix: Which sources are sending visitors who actually convert, even if the absolute numbers are small?
- Content performance: Which pages or posts are attracting the most relevant visitors and generating the most inquiries?
- Audience behavior: When do your visitors arrive, what do they look at, and where do they exit?
What requires caution at small scale:
- Statistical significance: Small sample sizes mean that apparent differences between segments or time periods may be noise rather than signal. Treat small-sample comparisons as hypotheses to test, not conclusions to act on.
- Predictive modeling: Machine-learning features in GA4 and other platforms require minimum conversion volumes to activate. If you don’t meet those thresholds, the predictions won’t appear — and that’s appropriate.
The practical discipline is consistent measurement over time. A business that tracks the same metrics, in the same way, across multiple seasons accumulates the longitudinal data that makes year-over-year comparison meaningful. That consistency — not sophisticated tooling — is the foundation of useful analytics for seasonal businesses.
What to Prioritize This Season
Analytics for seasonal businesses in 2026 is less about adopting new platforms and more about using existing tools more deliberately. The businesses that will make better decisions are those that:
- Build and maintain their own seasonal baselines rather than relying on industry benchmarks
- Collect first-party data systematically, with clear consent, and connect it to their marketing and sales workflows
- Configure attribution models that reflect their actual buying cycles rather than defaulting to last-click
- Treat sparse data as a constraint to work within honestly, not a problem to solve with more tools
If you’re looking to build a more structured approach to marketing measurement for your northern or seasonal business, the ArcticMarketer resource library covers analytics, content strategy, and channel-specific tactics designed for the realities of remote and cold-climate markets.
The seasons will keep turning. The businesses that read them accurately — and act on what they learn — will be better positioned when the next peak arrives.